Debug
Before publishing the setup or commencing a new experiment, it is crucial to ensure that it is functioning correctly. Otherwise, confidence in the experiment's results and the collected data cannot be assured.
GTM experiments
To verify that the experiment is working properly, we need to preview the changes on the website via Google Tag Manager (GTM).
- Open the Preview mode in GTM.
-
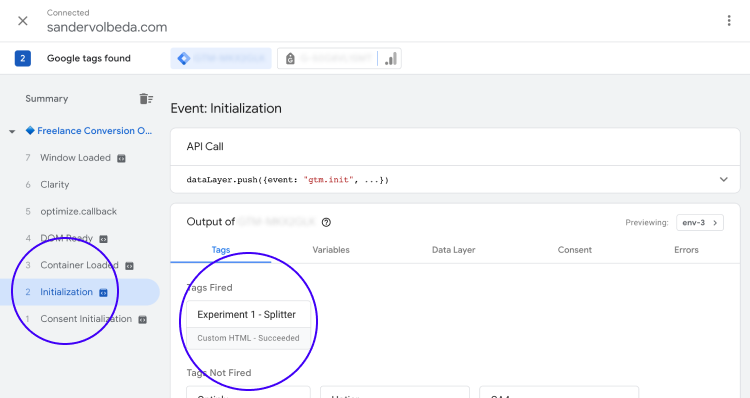
Navigate to the second step of the preview. The Experiment 1 – Splitter tag should be fired.
-
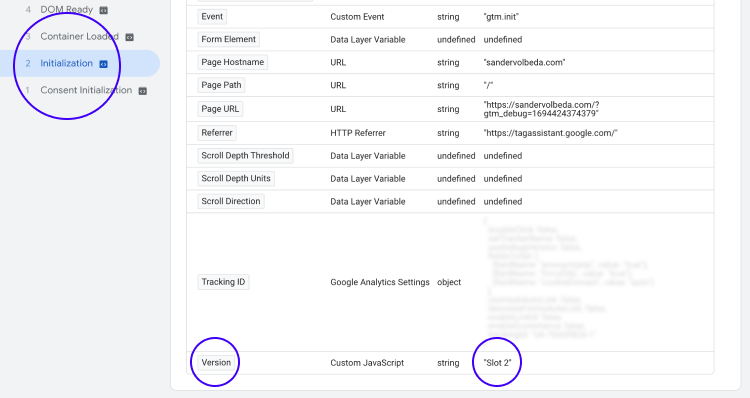
Move to the Variables tab and check if a Slot has been set with the Version (bottom row)
-
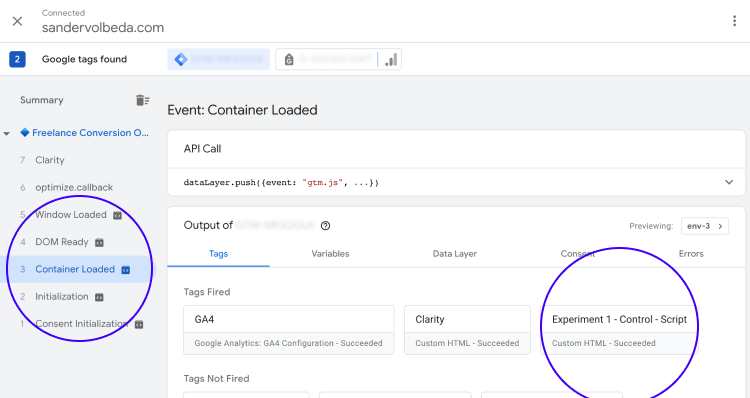
Navigate to step 3 in the left sidebar and verify whether Experiment 1 has been triggered. Depending on your version, the Control should be fired if your slot falls between 0 and 4, while the Variant should be fired if the slot value ranges from 5 to 9.
-
Open the website (still in preview mode of GTM), right-click and select Inspect. Now open the Console tab and check if there’s anywhere
Control loadedorVariant loadedin the content.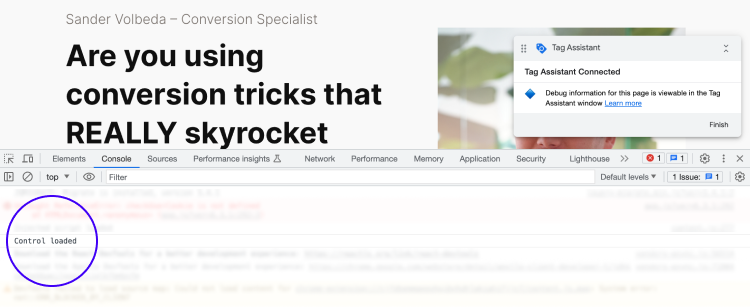
Leave the GTM preview mode open before heading to the next step.
GA events
To use the Debugger view in GA, you will need to add the Google Analytics Debugger extension to your browser. This functionality applies to every website present in your Google Analytics account.
- Activate the extension on the preview page of GTM.
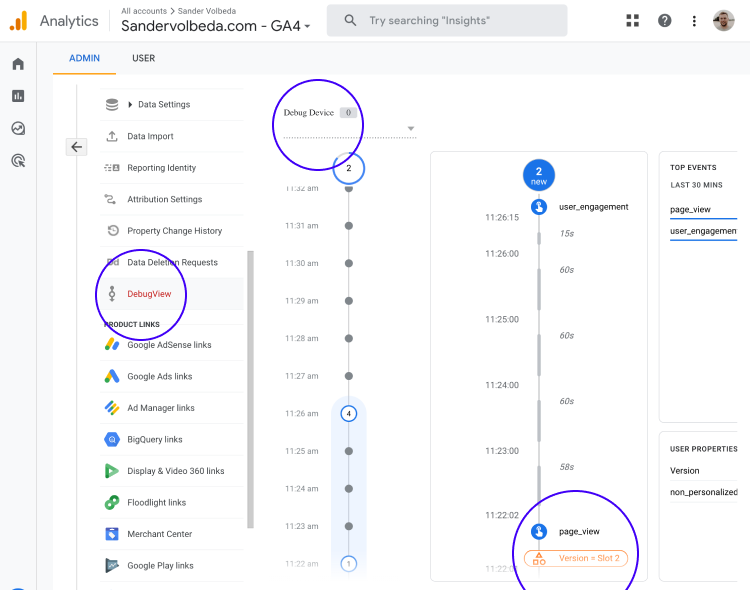
- Go to Admin > Account > Property in the GA account.
- Check for DebugView (the last item in the first list).
- Select your device from the dropdown. This may be difficult, but please try.
- Check if the Version is shown in the debug list.
If the tag is configured correctly, there should be an orange user property with the version just below the page view event.
Remember, as mentioned earlier, it can take up to 48 hours for data to be